Flagship platform
ZUNOX Capacity IntelligenceUnderstand work at the level where value is actually created.
Zunox creates an evidence layer between organisational activity and business economics. It helps organisations understand how work consumes capacity so they can improve processes, deploy automation intelligently and measure the effect of change.
The problem
Headcount tells you who you employ. Systems tell you what happened. Neither tells you where capacity went.
Organisations rely on a familiar set of methods to understand work: workshops, interviews, timesheets, process maps, system statistics, self-reporting and assumptions.
Each is useful. Together they still leave an incomplete picture of real operational work, because none of them observes how the work actually happens.
Zunox adds direct evidence.
Conventional inputs
Capacity Intelligence
The Capacity Intelligence model
Operational signals enter an evidence layer, are attributed to meaningful work, and come out as intelligence you can act on and defend.
Inputs
Evidence layer
- Capture
- Attribute
- Analyse
- Reconcile
Outputs
Sample readout
What a Zunox readout looks like
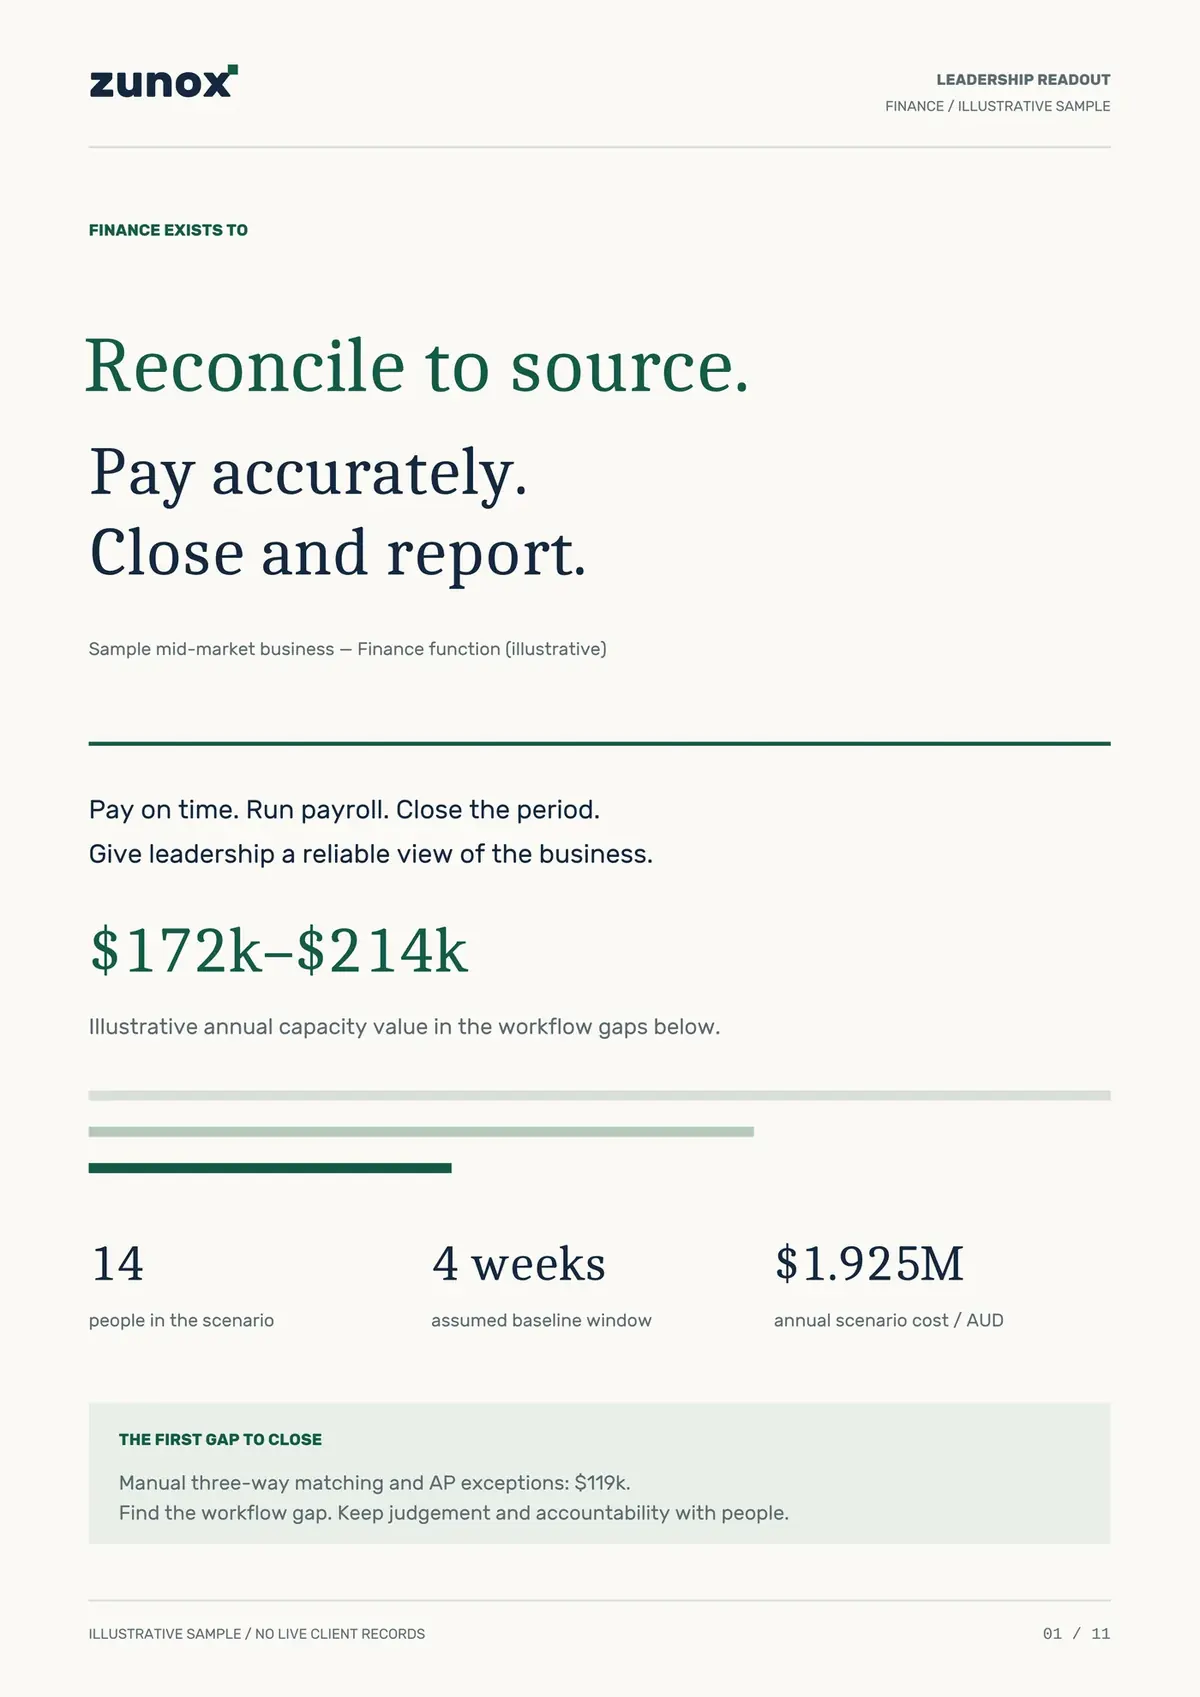
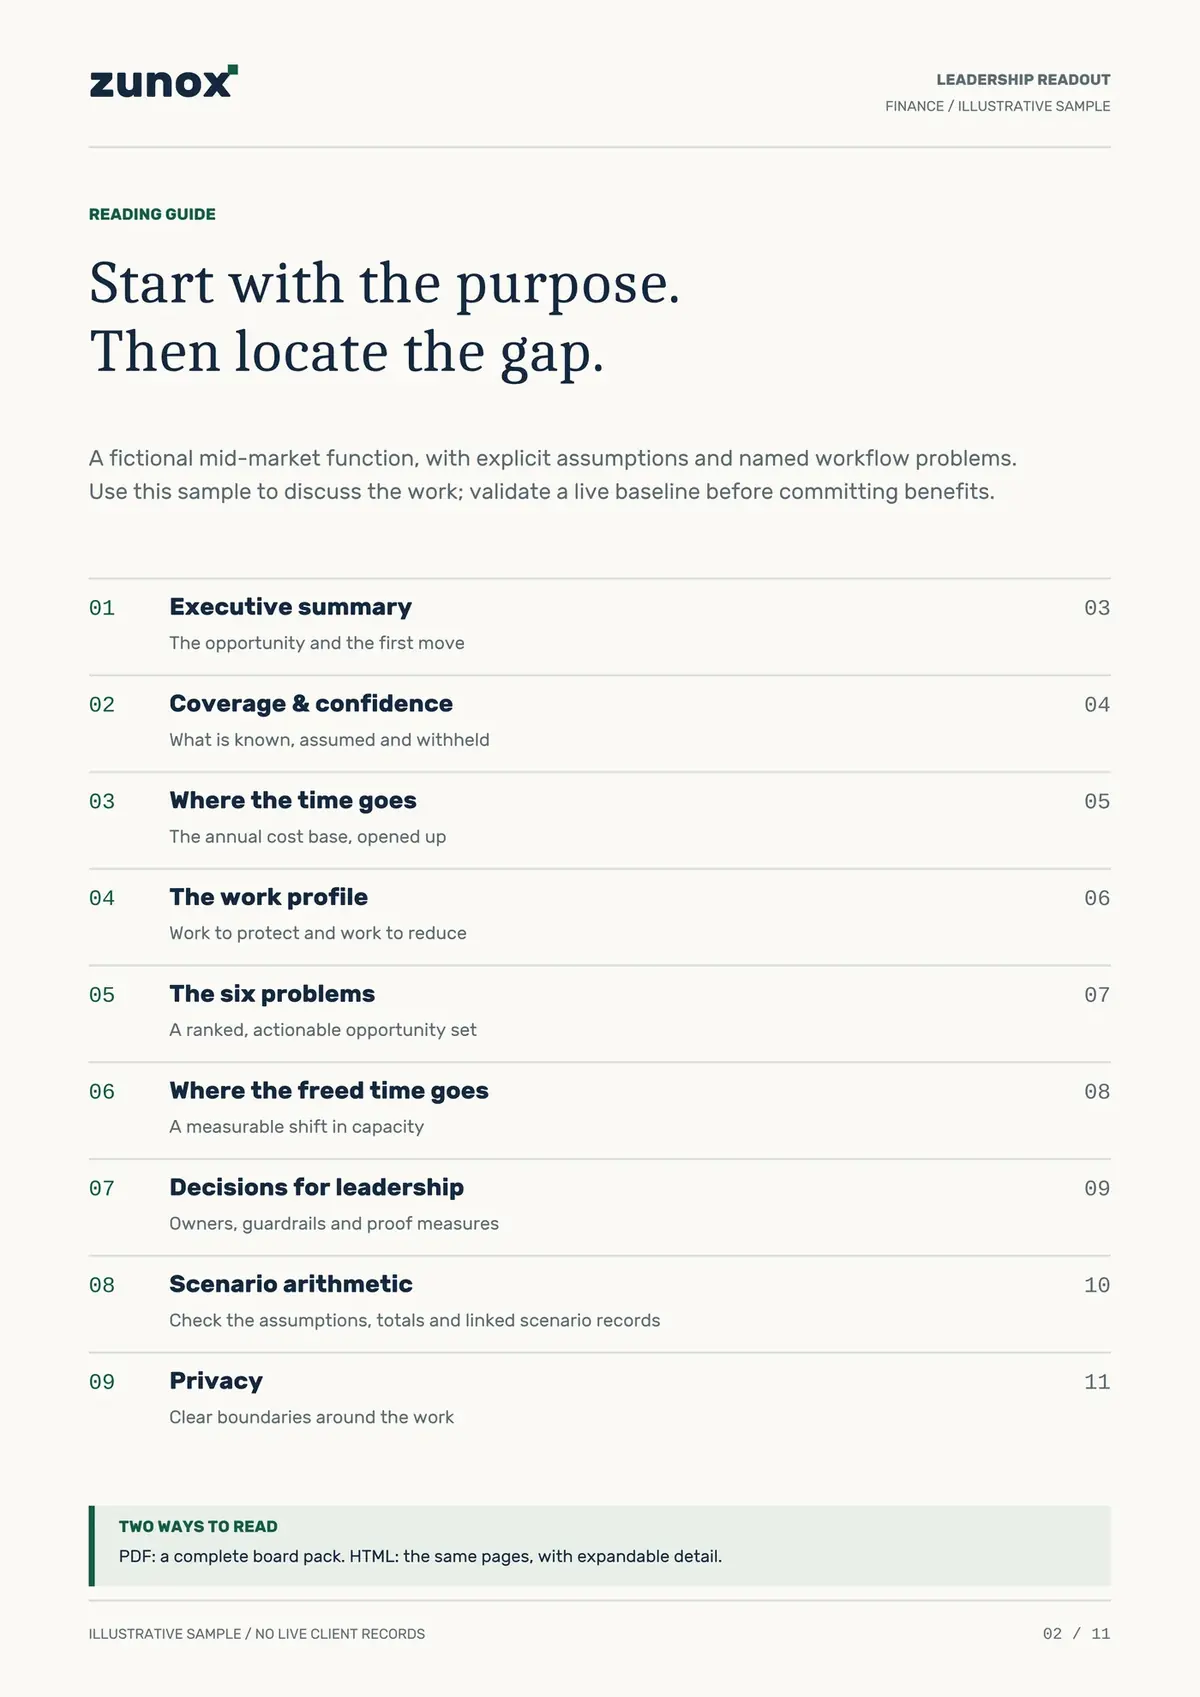
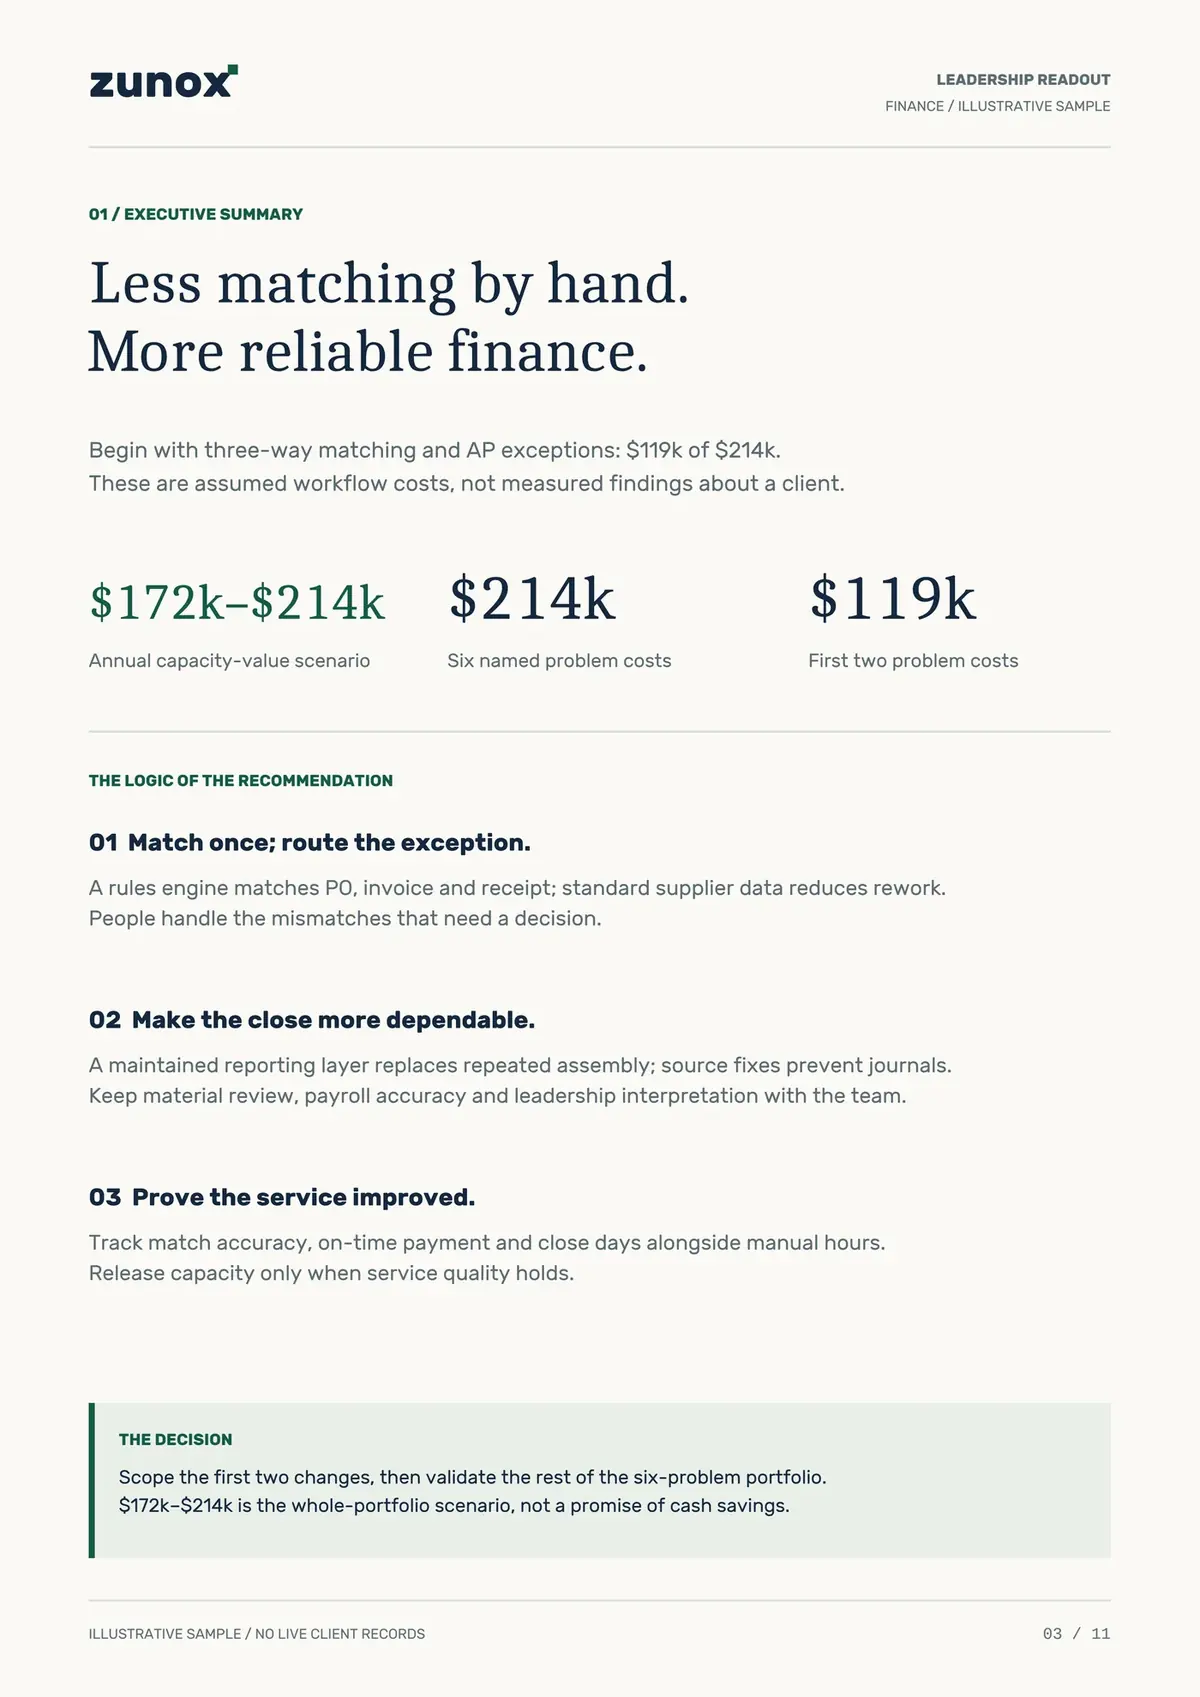
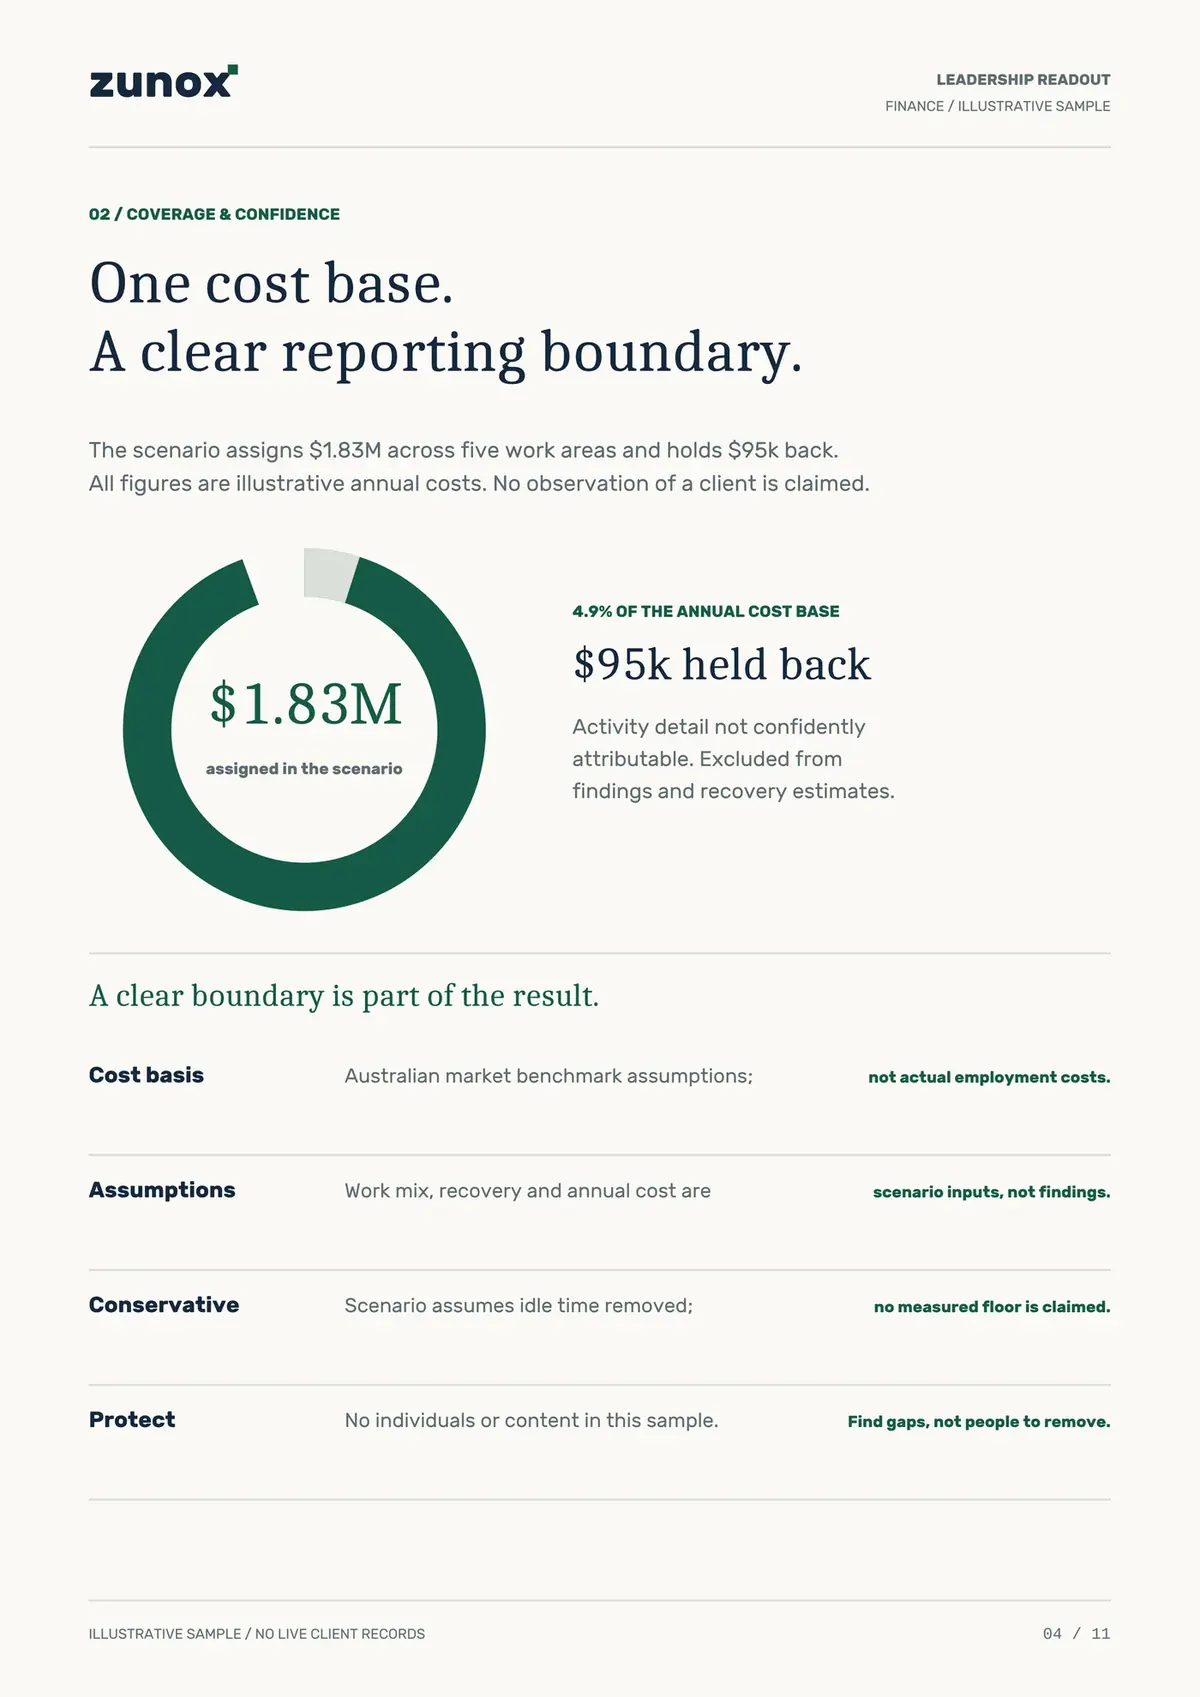
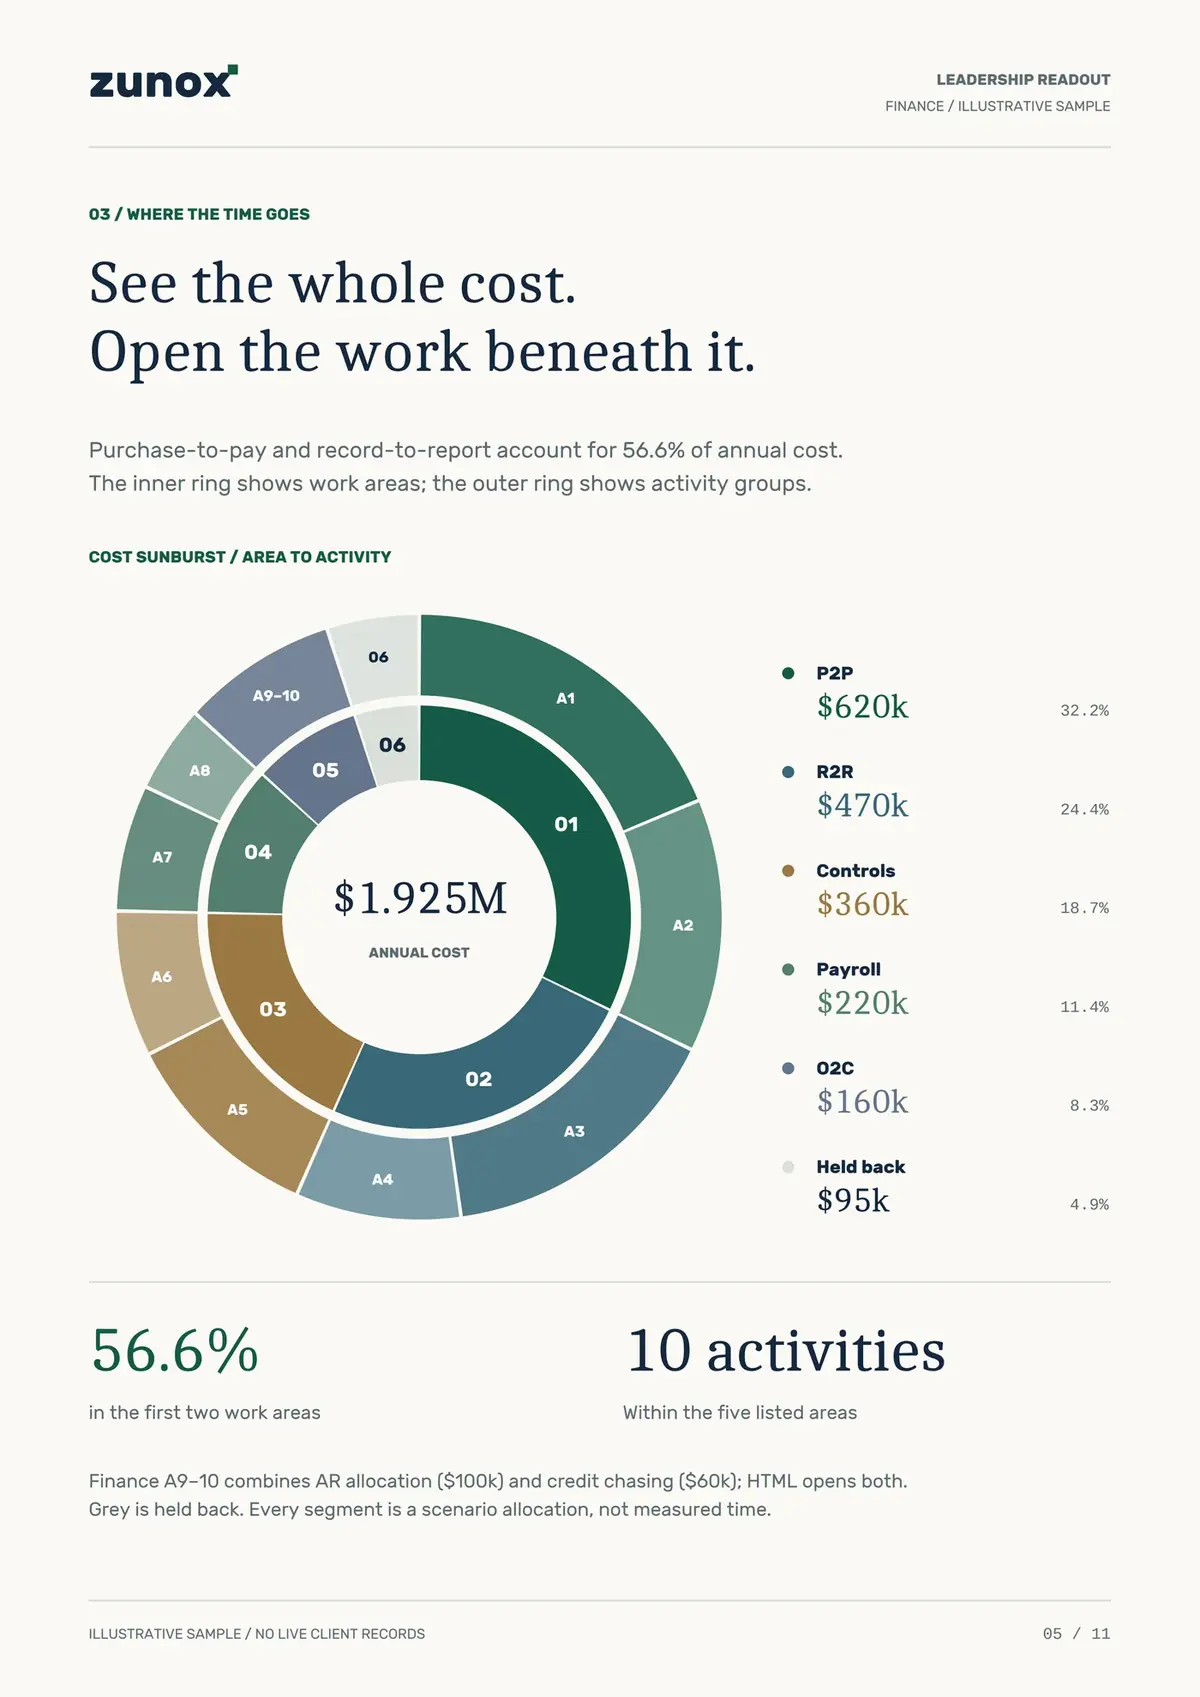
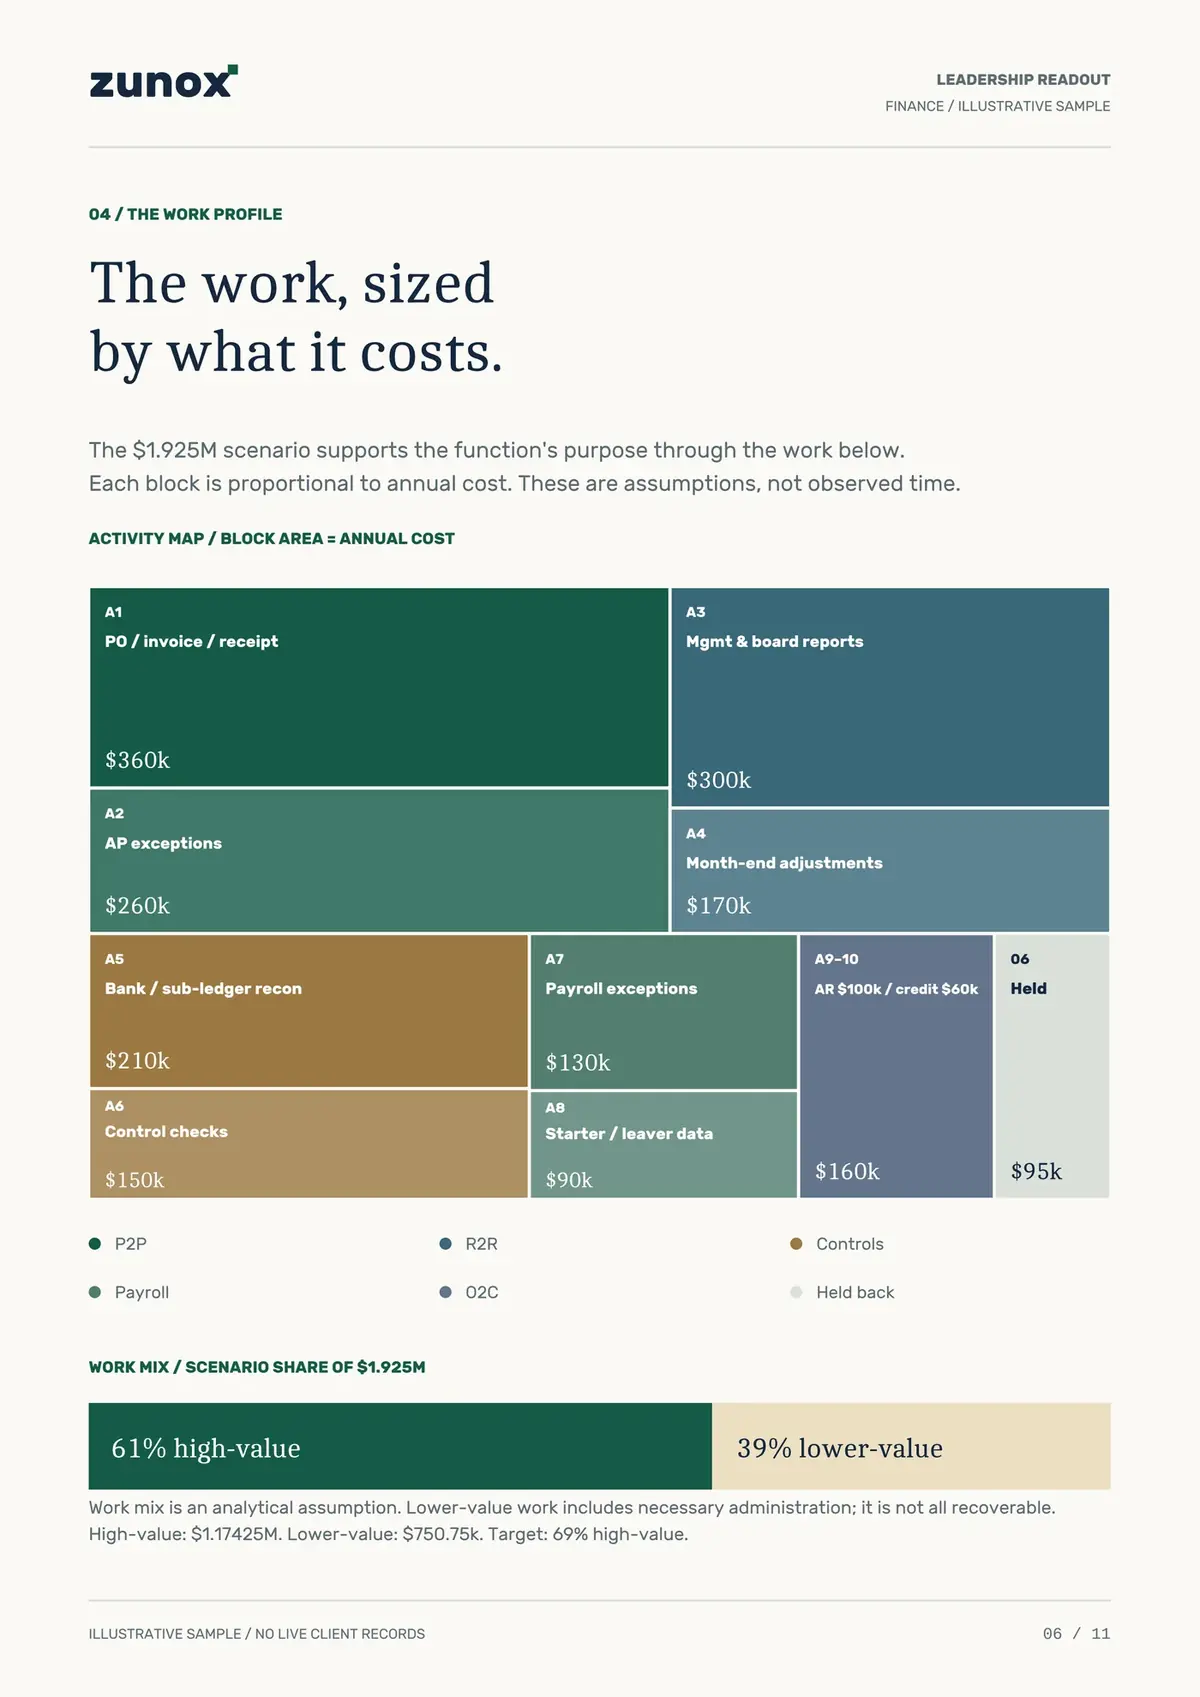
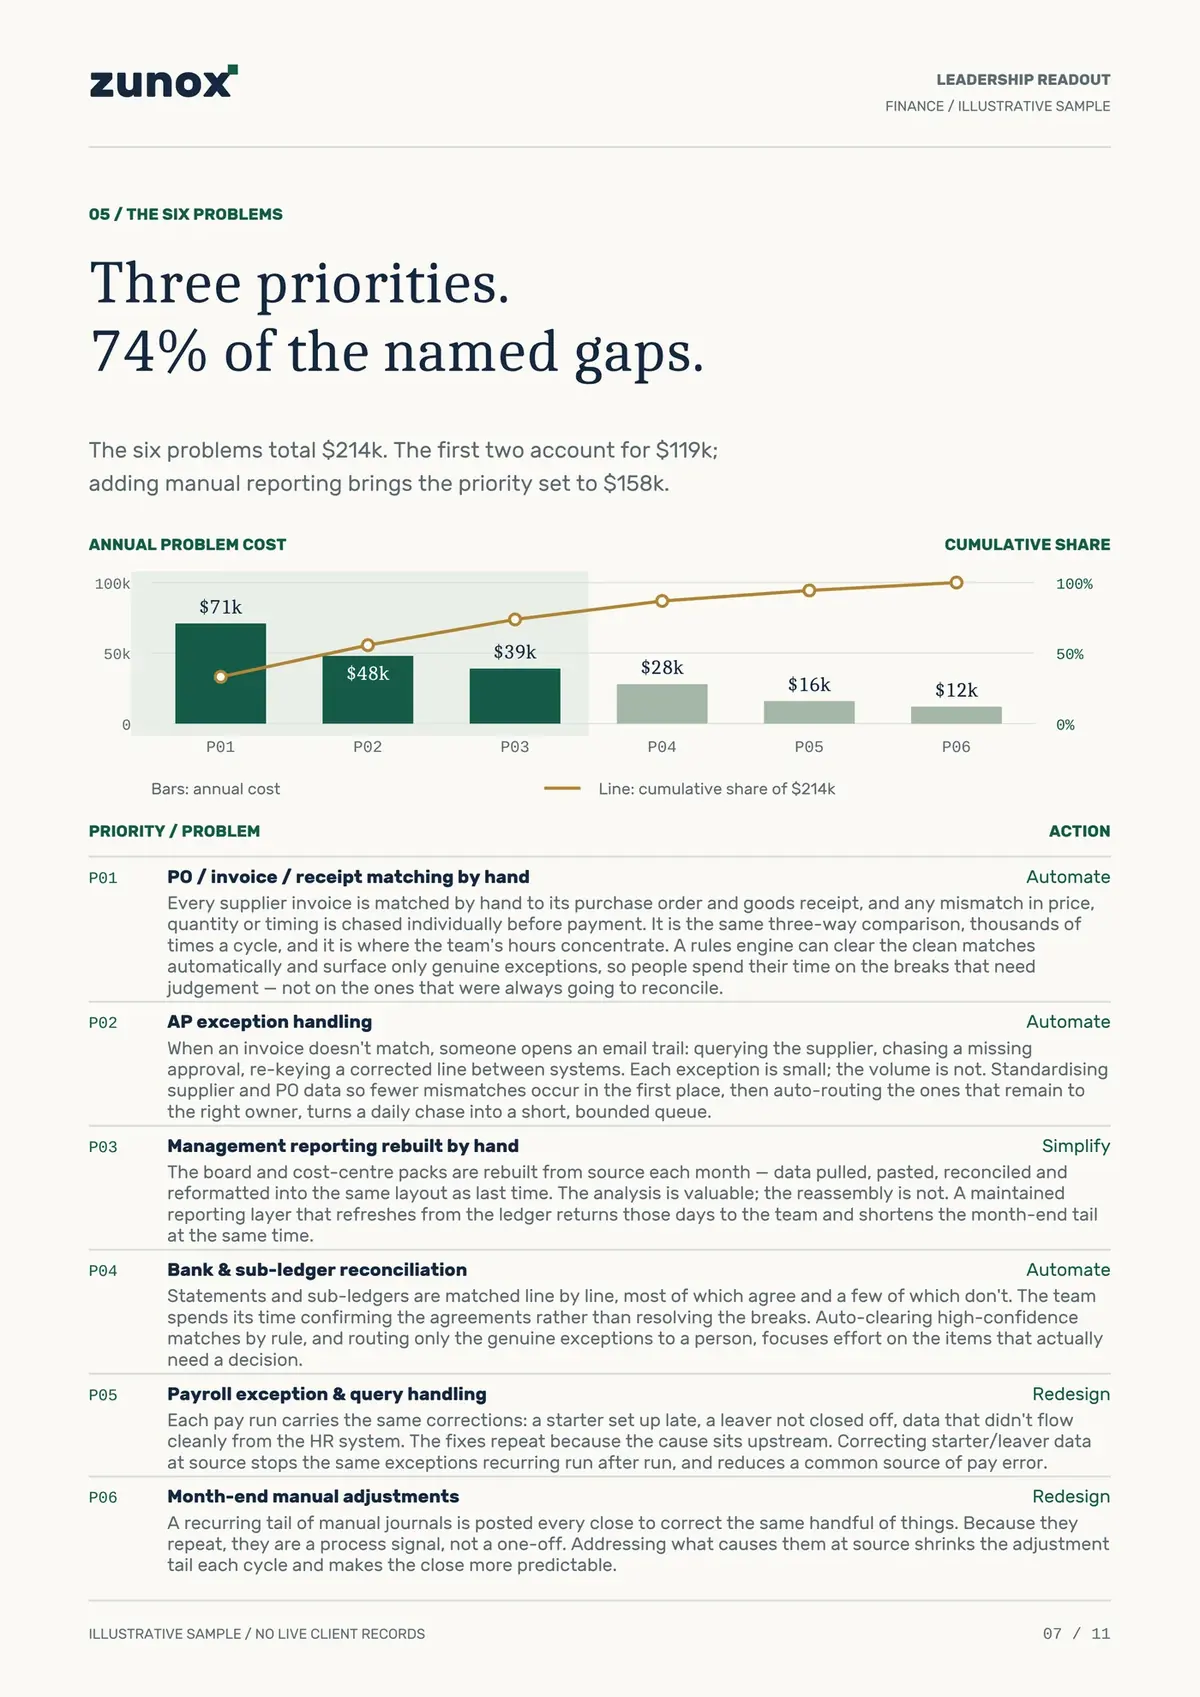
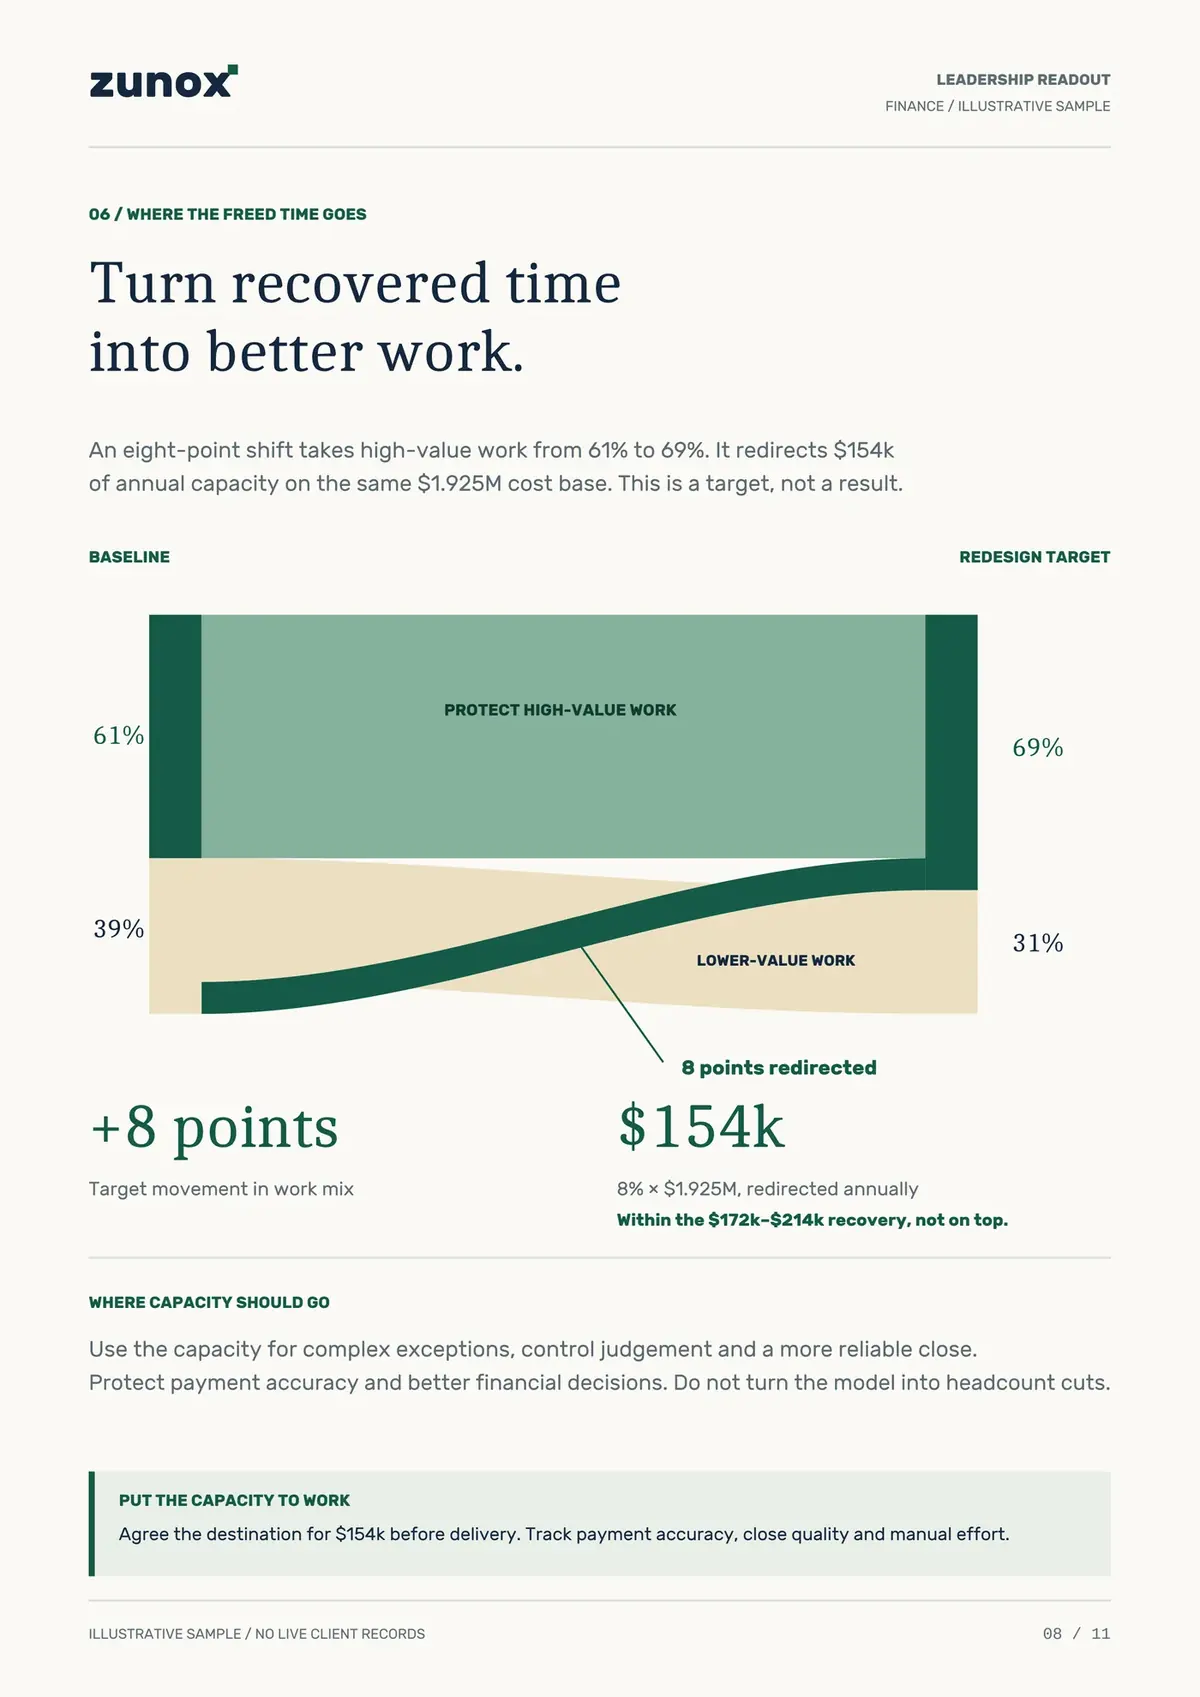
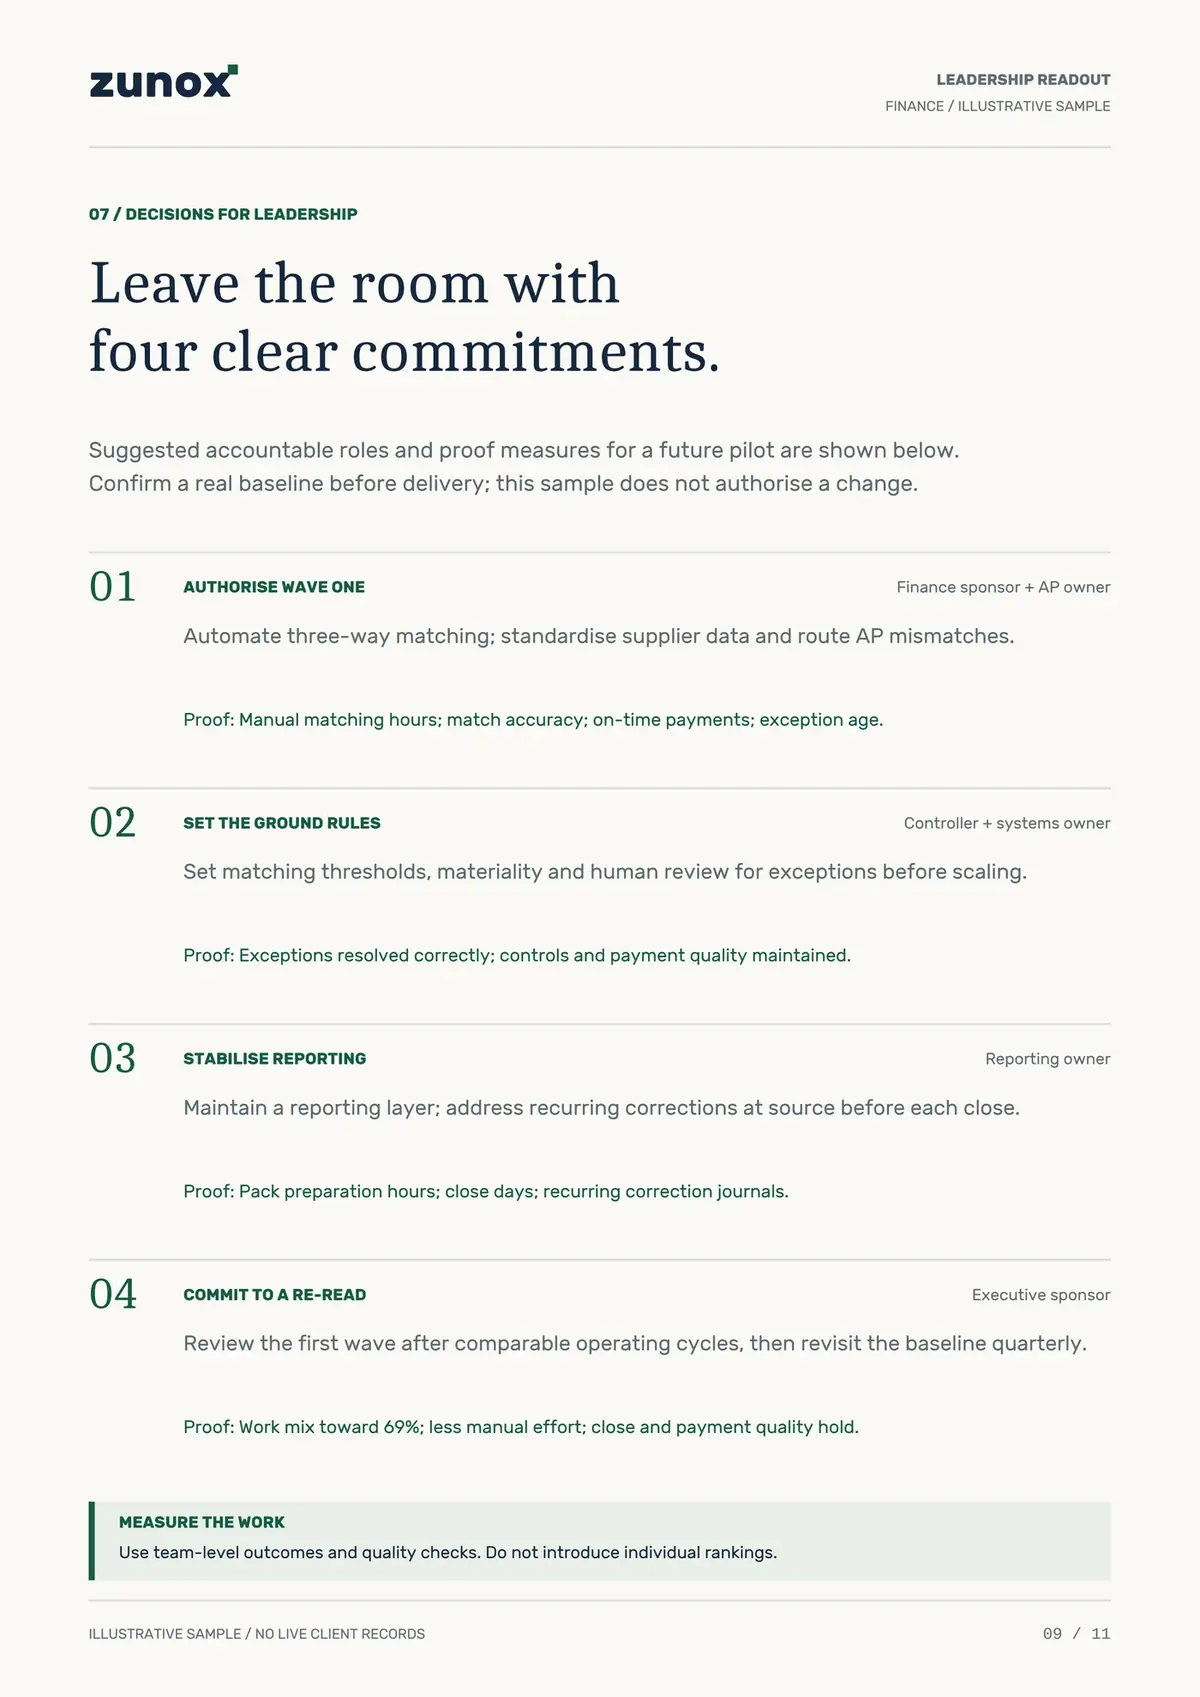
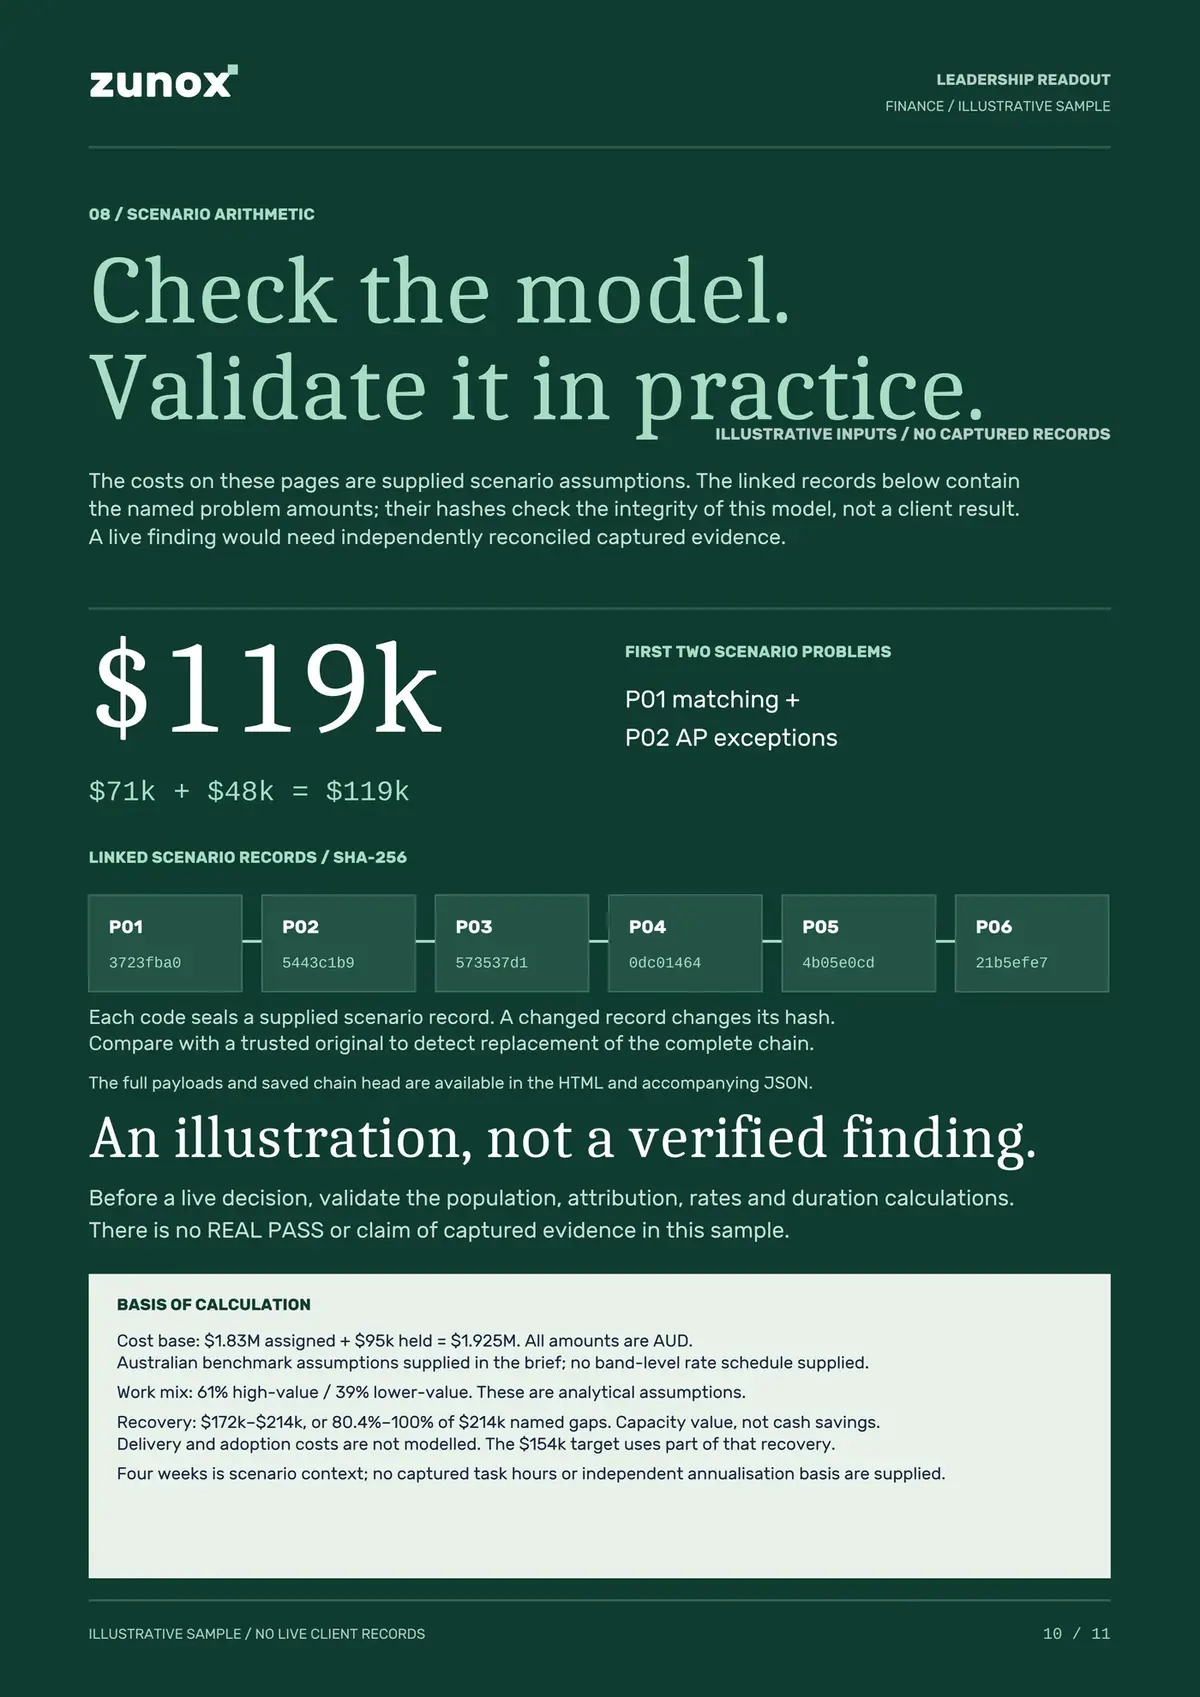
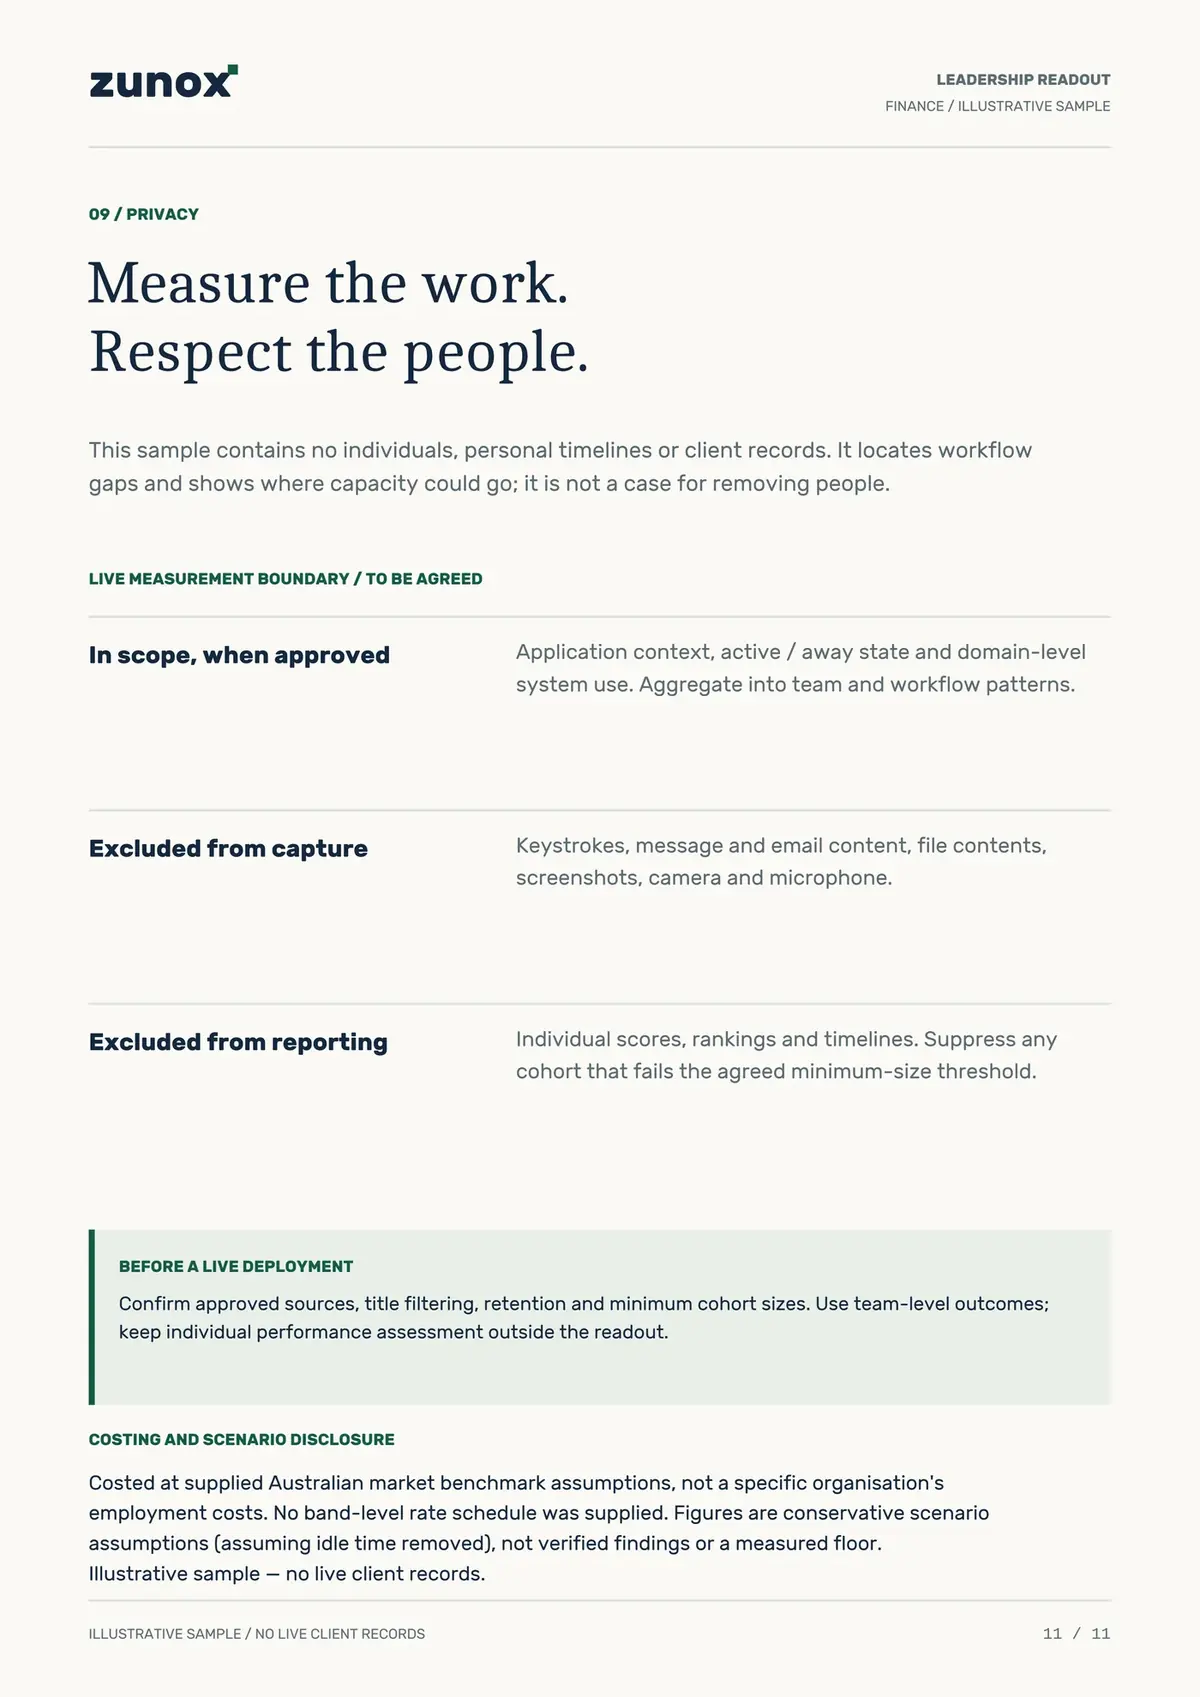
Illustrative sample. Figures are examples, not results from a client engagement. Scroll within the panel for all 11 pages, or open the readout as a PDF
Product principles
What the product is built on
Evidence before assumption
Recommendations should be grounded in observed work.
Work, not surveillance
The purpose is to understand organisational capacity, not score individuals.
Economics matter
Automation only matters where it creates measurable value.
Trust the measurement
Reported figures should be traceable to the underlying evidence.
Questions
What can Capacity Intelligence tell you?
- Where is organisational capacity actually being spent?
- Which activities absorb disproportionate effort?
- Which applications create friction?
- Which processes are fragmented?
- Which work is repetitive?
- Where are teams moving information manually?
- Which work is suitable for automation?
- Where could AI release capacity?
- What changed after process redesign?
- Did automation actually reduce manual work?
- Where is realised value appearing?
- What work should remain human?
Assurance
Capacity Intelligence must be defensible.
If a business decision is based on a capacity figure, that figure needs to be explainable. Zunox is engineered around evidence, reconciliation and traceability.
A capacity report should never claim more than the underlying evidence can support.
Engagement
How an engagement works
1. Scope
Agree the team, systems and questions to answer
1 week
2. Observe
Capture enough operational evidence to identify recurring work patterns, capacity consumption, friction and variation across a representative working period.
20 business days
3. Readout
Capacity, friction, opportunities and economics, backed by evidence
1 week
4. Decide
A prioritised change and automation plan, with a baseline to measure against
1 week
The full engagement is approximately 7 weeks end-to-end.